How to read and generate reports
On this page
Reports answers two different questions: how the year is going and what exactly happened. The screen answers the first on its own; you ask it the second, in your own words.
You need finance permission to open it. Every figure comes from your invoices, payments and recorded expenses — nothing here is estimated.
Asking a question
-
Open Reports in the sidebar, under Finance. It is its own entry — not inside the Finance dropdown.
-
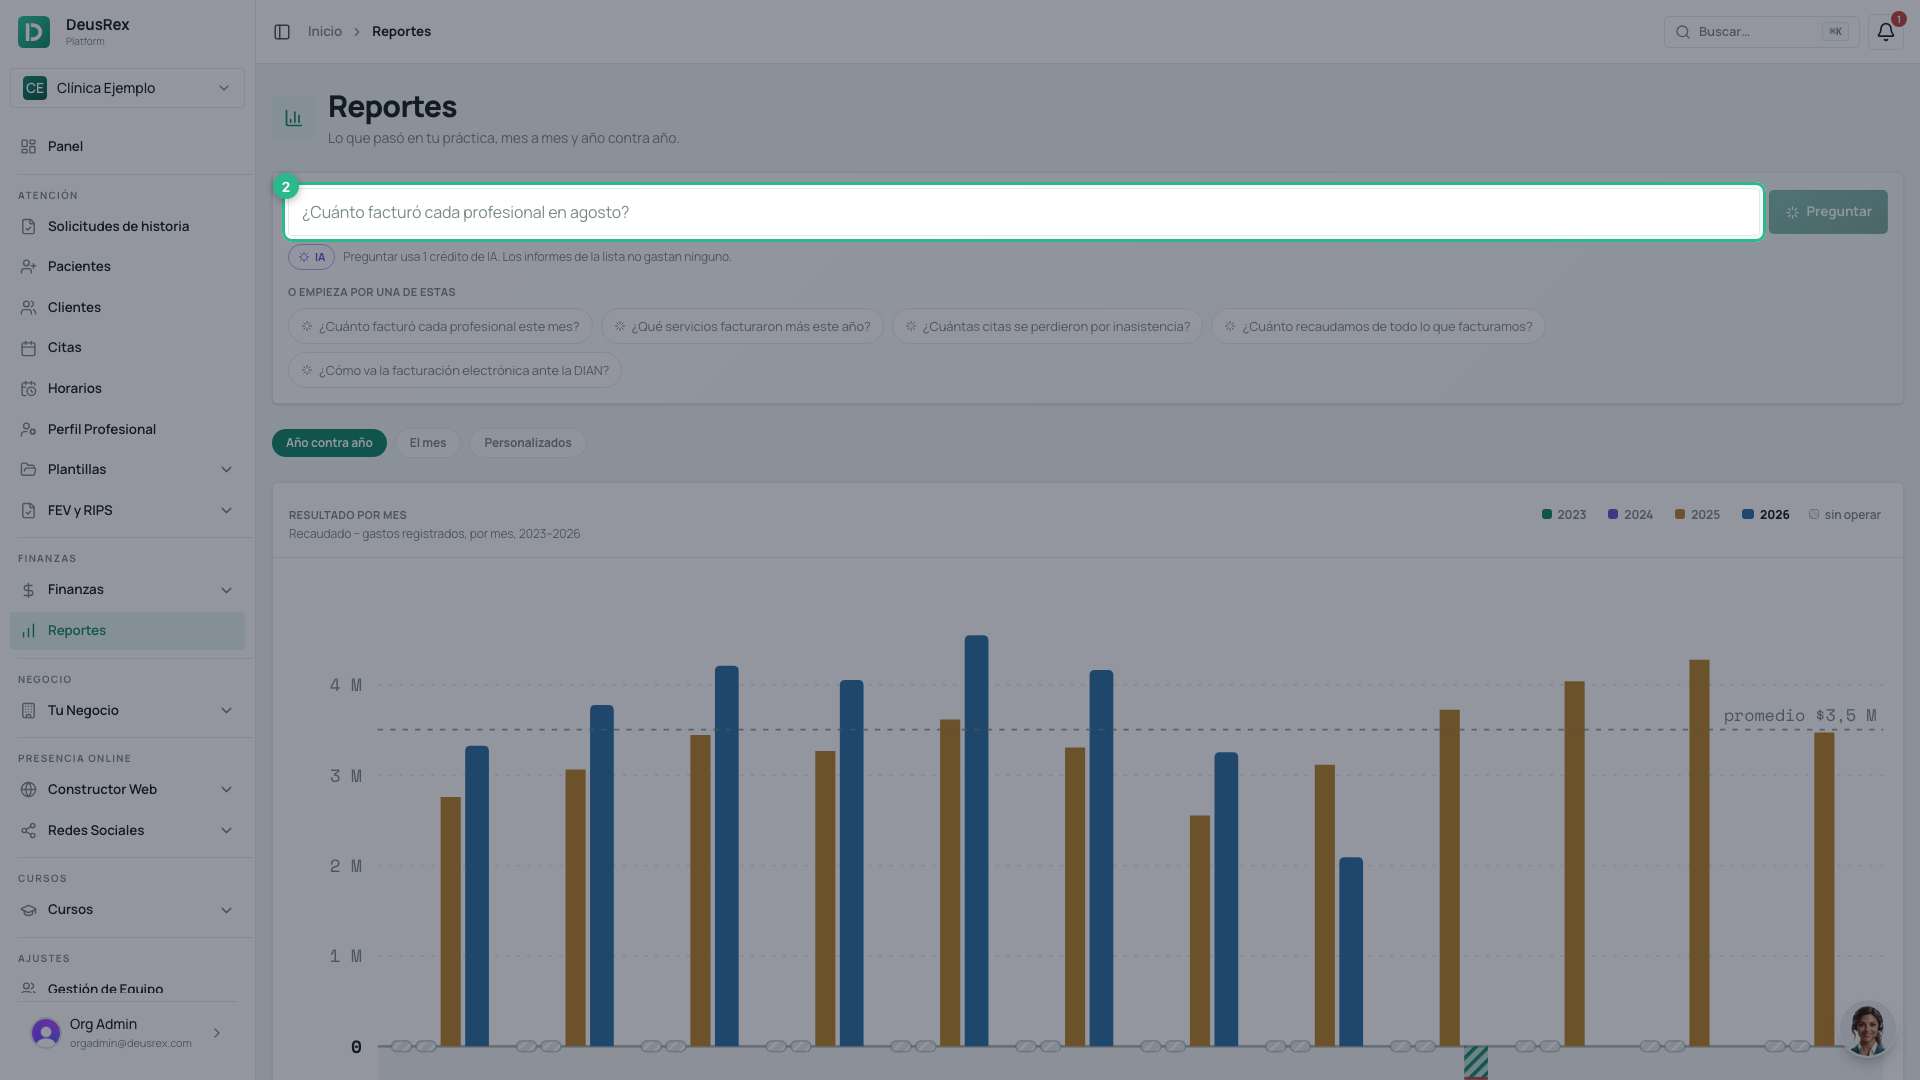
Type your question in the box at the top, the way you would ask a colleague: How much did each professional bill in August 2026?
-
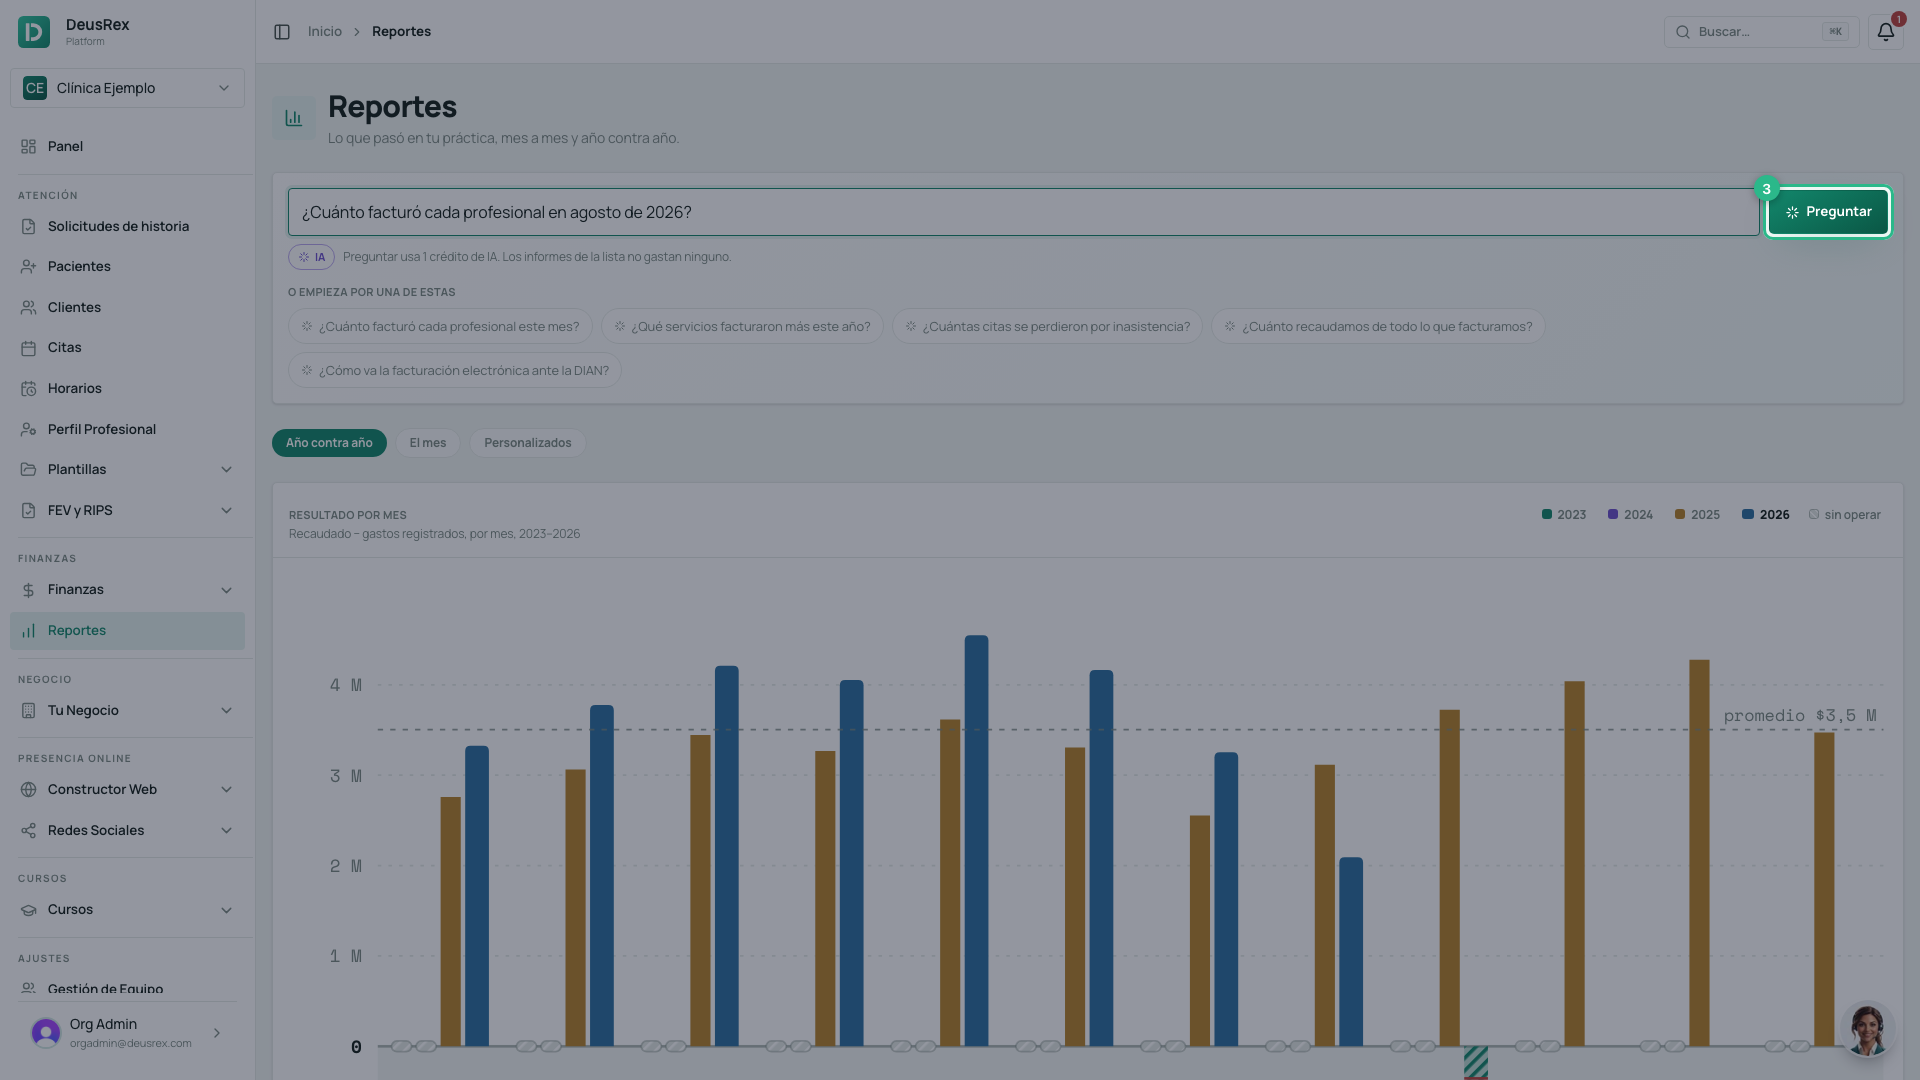
Click Preguntar.
-
Before showing any figures, we tell you how we understood the question. Read it: if we picked a different period or the wrong breakdown, ask again with more detail rather than reading a number that answers something else.
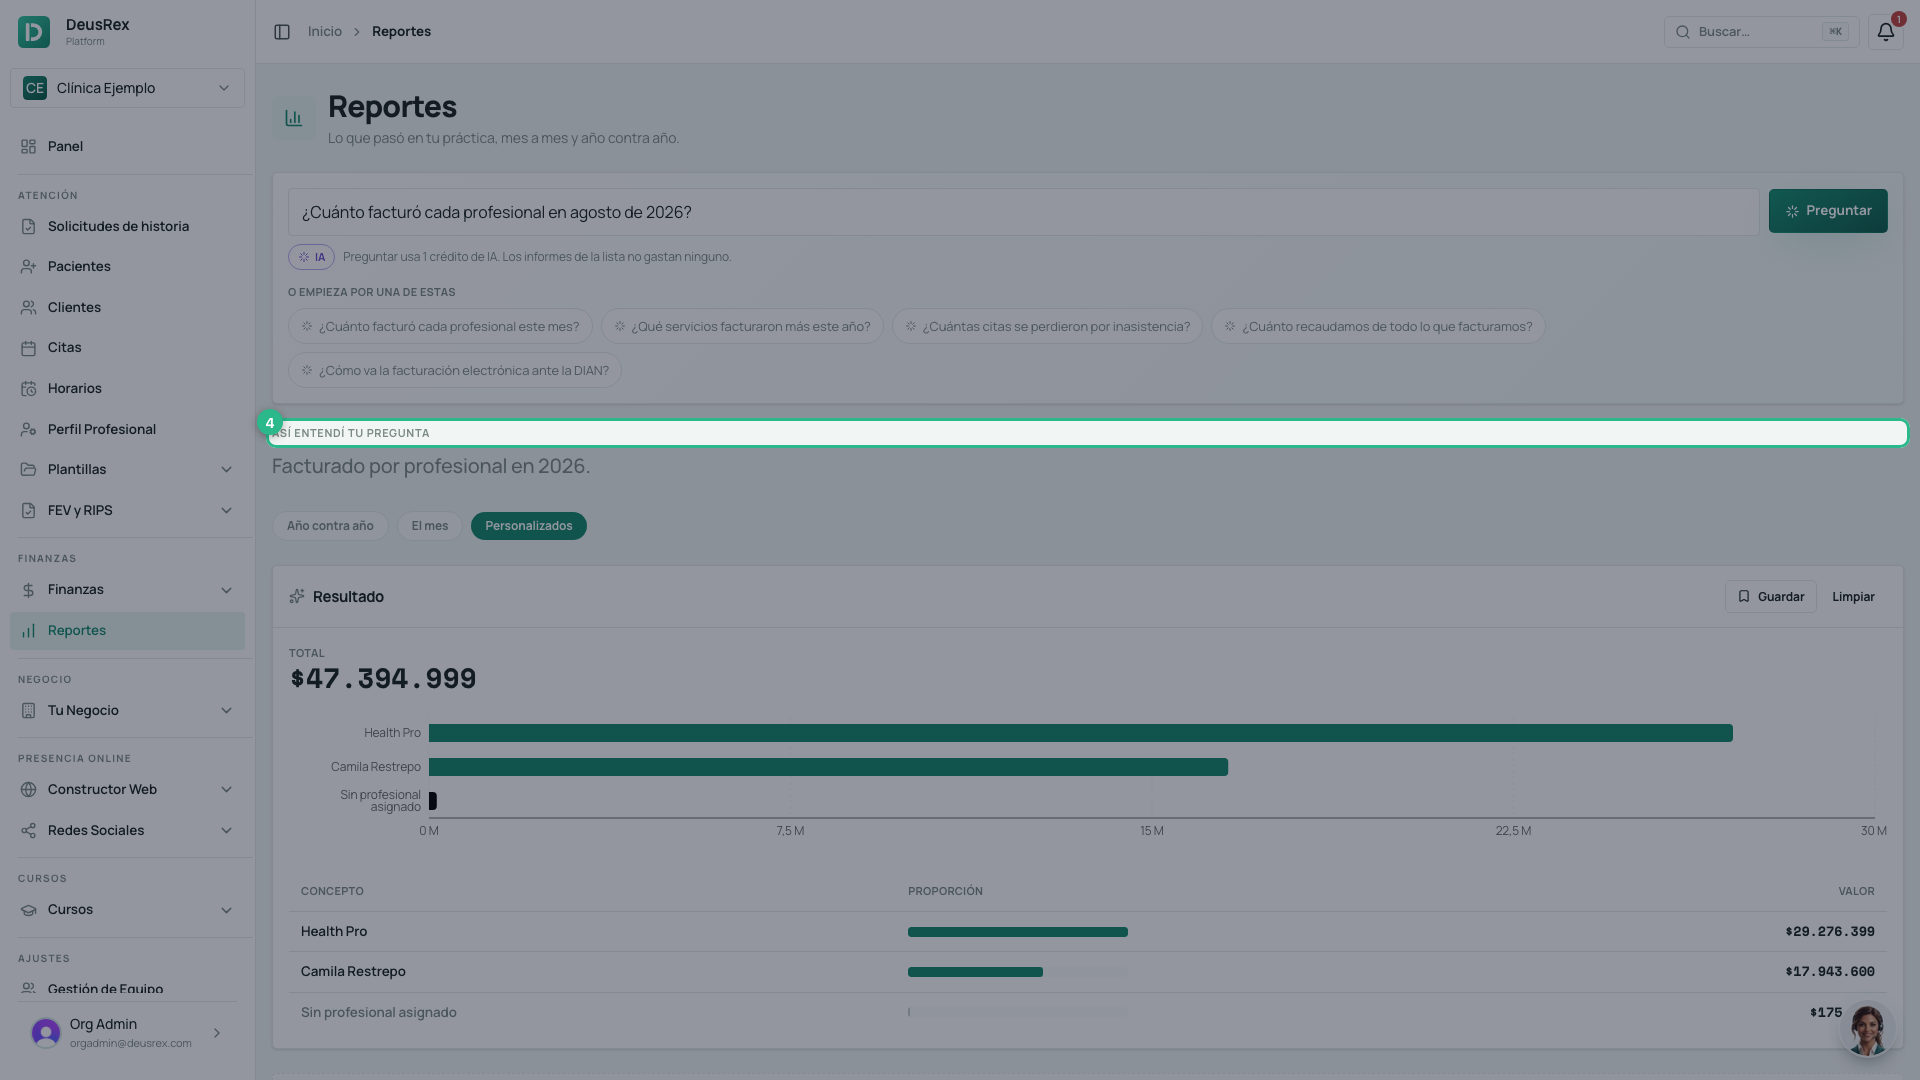
The result appears below, drawn with whatever chart fits what you asked for: columns for months, a donut for something that splits into parts (payment methods, lines of business), bars when you compared people or services.
Asking spends one AI credit. The three tabs and the analyse button spend none.
When we say no
Some questions cannot be answered, and we tell you why rather than showing an error. “How much did we collect per service” has no answer: a payment covers a whole invoice and cannot be split across the services on it. Refusing is better than a number that looks right.
Saving a question for next month
-
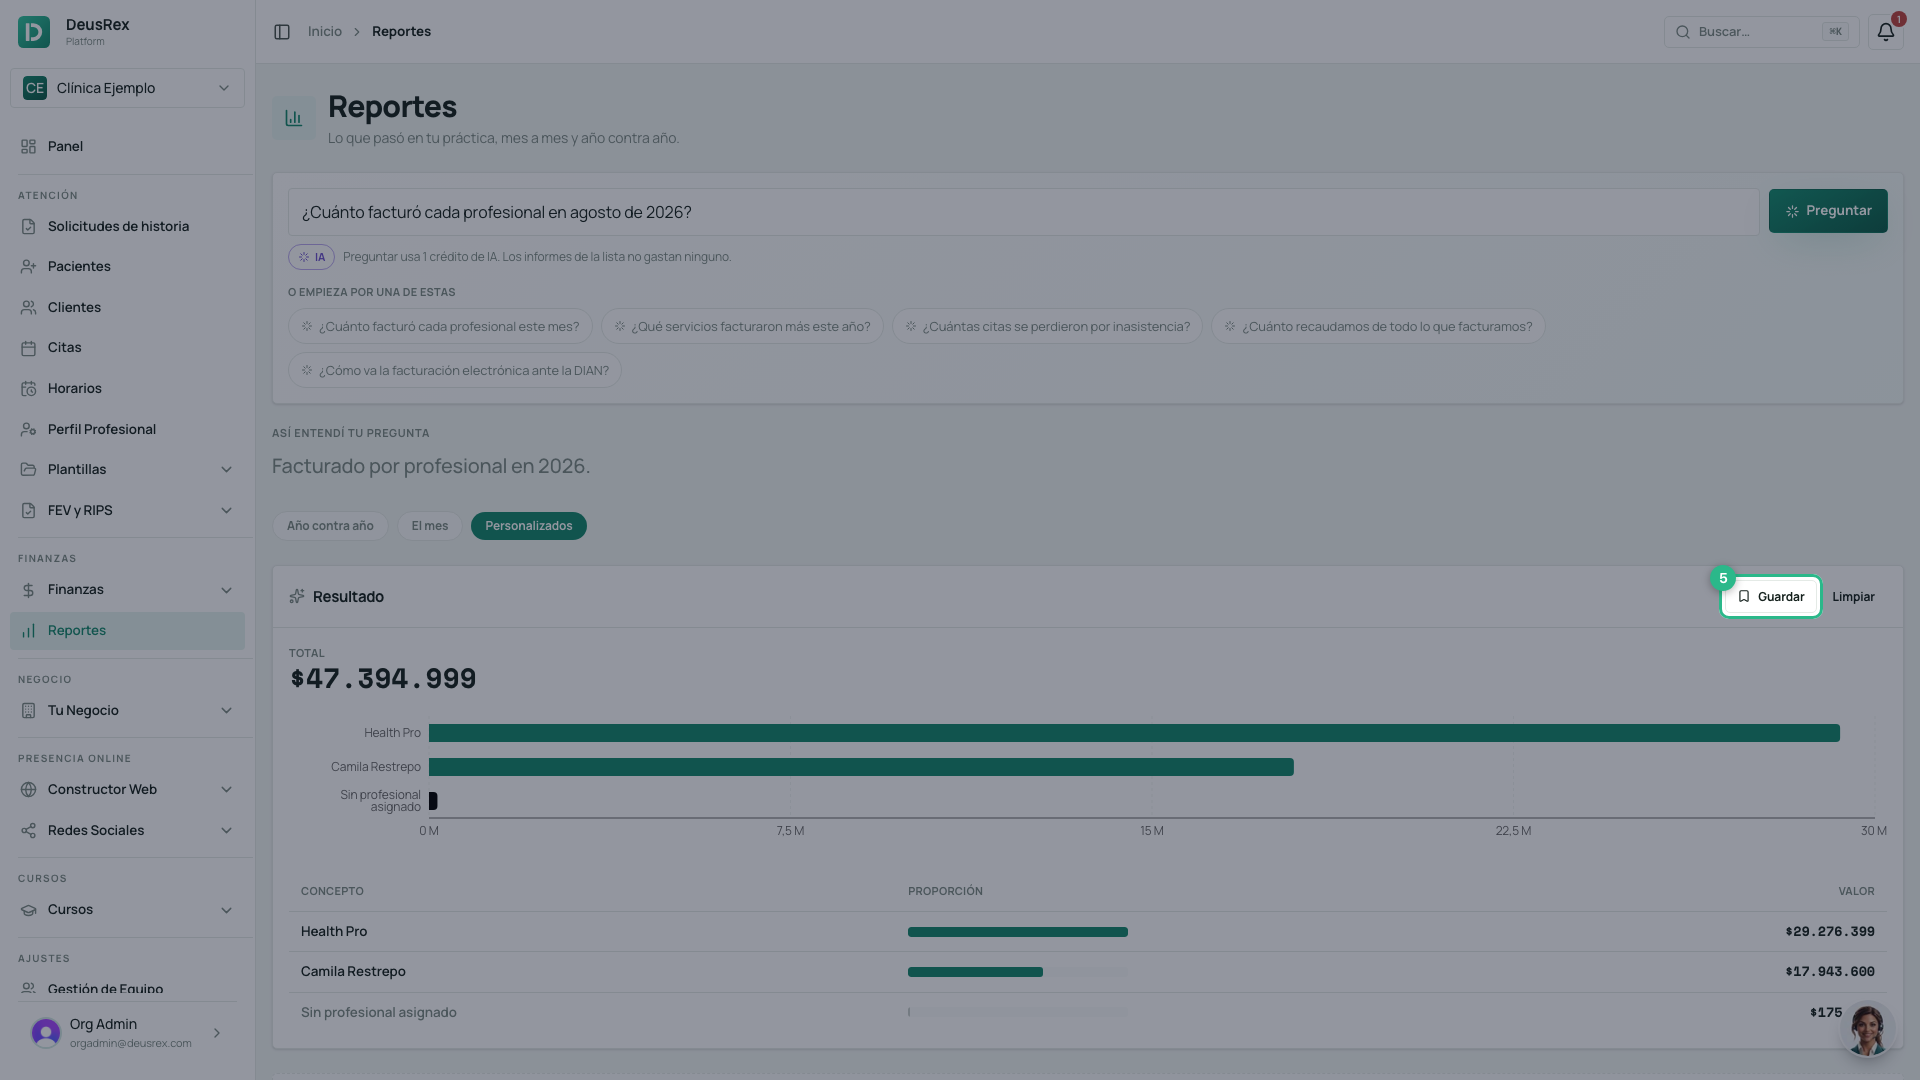
With a result on screen, click Guardar.
-
Give it a name and — this is the part that matters — choose the period:
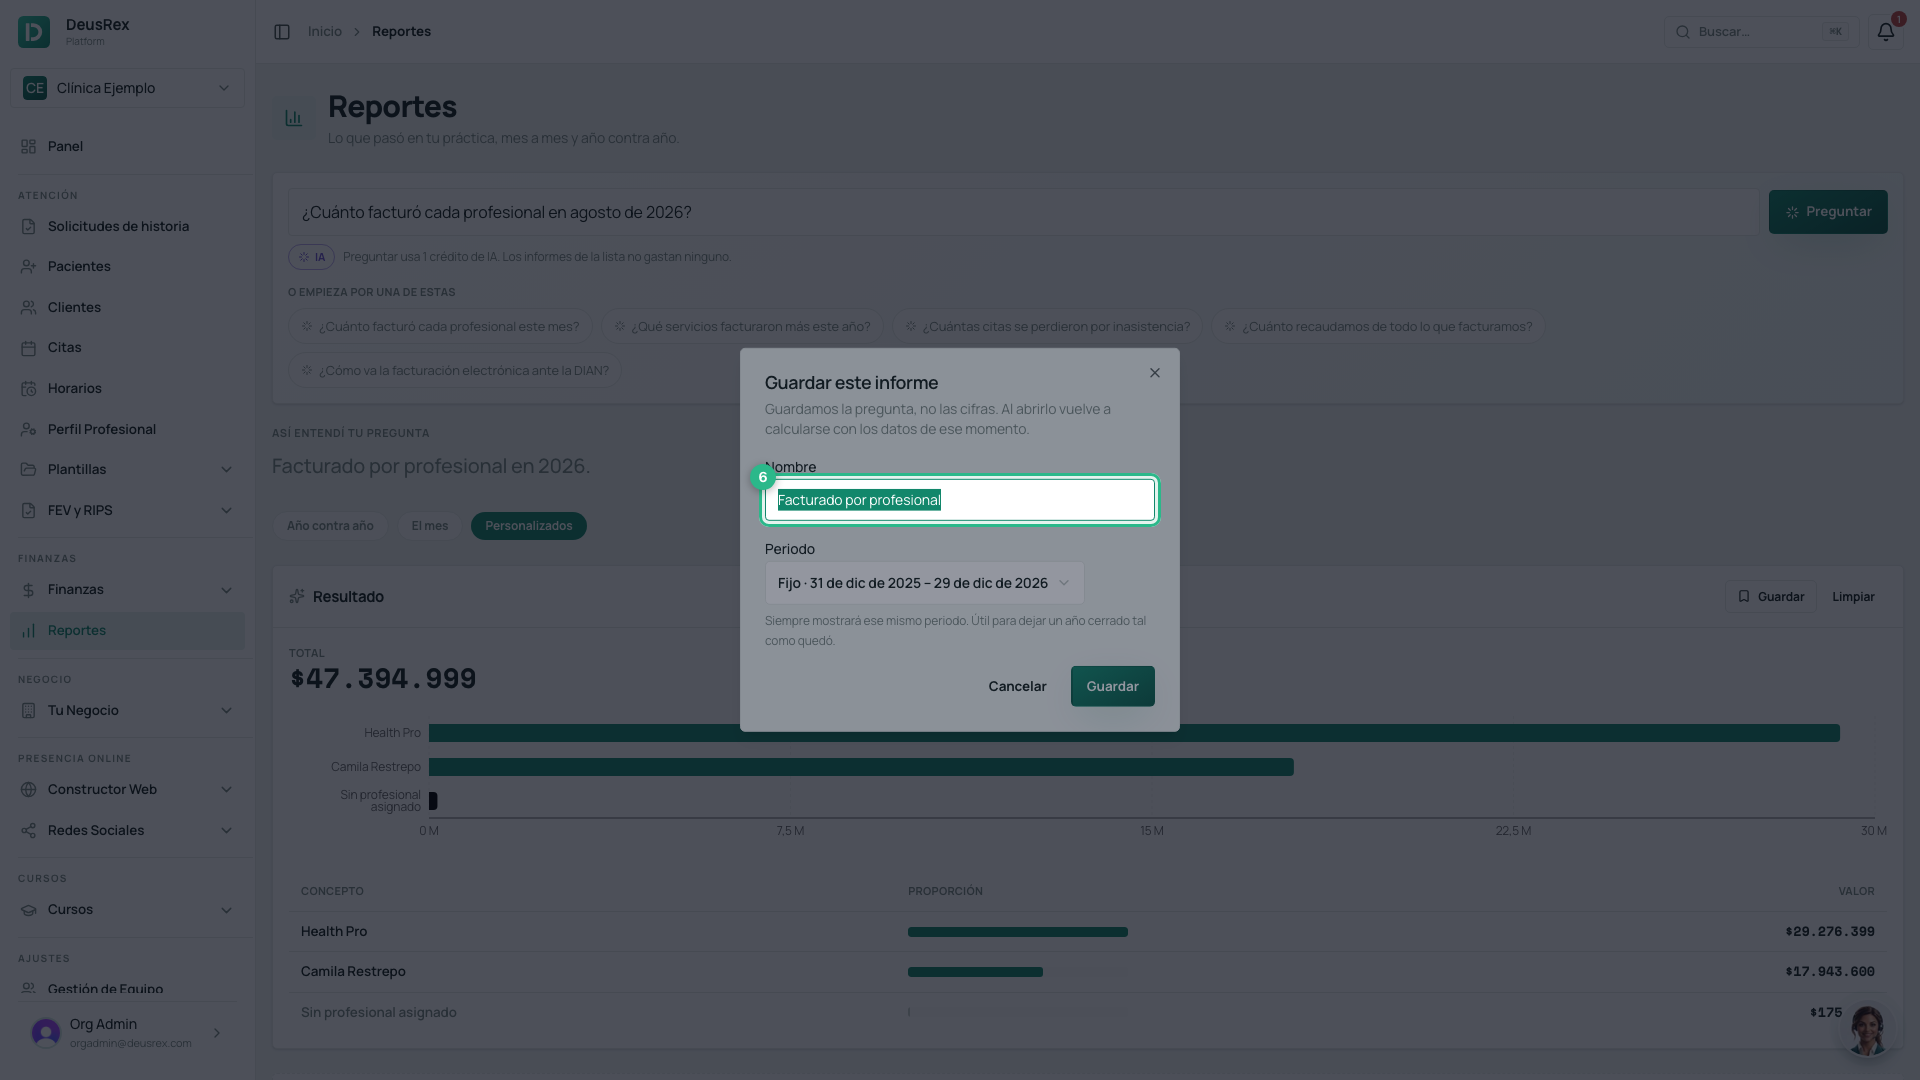
- Fijo keeps the same dates forever. Use it to leave a closed year as it stands.
- Este mes, el mes pasado, últimos 3 meses… move with you: next month they show next month.
-
Click Guardar. It lands in the Personalizados tab, and reopening it recalculates against the data at that moment.
We save the question, not the figures.
The three tabs
- Año contra año — the same month of each year, side by side. This is the view for finding the month billing fell. Click a year in the legend to hide it and compare only the ones you care about.
- El mes — the last closed month: billed, collected, receivables by age, and revenue by line of business.
- Personalizados — what you have asked and saved.
In the year-over-year chart, a month marked importado is a figure you brought from your spreadsheet rather than one calculated here: there is no detail to open.
Analysing a month or a year
Año contra año and El mes each have an Analizar button. It reviews the whole period and returns, in one go:
- the headline figures — billed, collected, appointments;
- what we found: overdue receivables, revenue concentrated in a few names, a month well below average, money with nobody attached. Each finding carries a button to the screen where it gets fixed;
- one section per breakdown, each with its chart and its table.
Only sections with something in them appear.
Findings are arithmetic over your own data. The AI writes the sentence; it does not decide there is something to say, and it does not invent the number.
Exporting to Excel or PDF
Two buttons sit in the analysis header:
- Excel — one block per section with raw numbers, ready to keep working in your own sheet.
- PDF — the document for your accountant or your files.
Both recalculate the analysis at the moment you download, so the file can never carry a different figure from the one you were looking at.
Frequently asked
Why is the month in progress missing from the averages? Because it has not finished. A month read on the 11th, compared against whole months, always looks like a collapse. You will see it on the chart, but it does not drag the averages or win the title of “weakest month”.
Why will it not calculate net margin? Because payroll is missing for some month in the period. Without staff cost the margin comes out higher than it really is, so we would rather not give it and tell you which month is missing.
Why does profit per product say a cost is missing? Because some product you sold has no unit cost recorded. Without it, profit would equal the sale. Add it on the product and ask again.